You Don’t Have a Data Platform Without Excel
•
Jelle De Vleminck
The Most Used Feature is “Export”: Why Your Data Stack Needs a Spreadsheet Strategy
We have all seen diagrams like the one below. It maps the “hero’s journey” of a modern data organization.
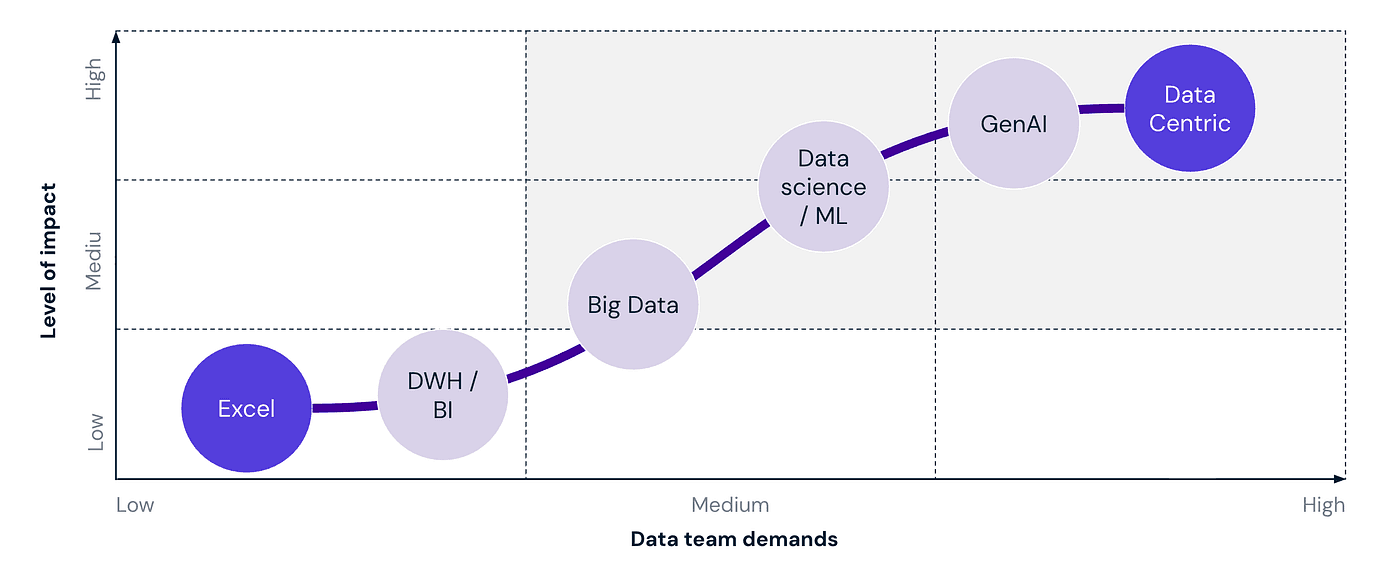
Pictured above: Data maturity stages to a data centric organisation
You start at the bottom left: Excel. It is viewed as the “low maturity” phase: unstructured, manual, and chaotic. The goal of every data strategy is to climb that curve.
The implied message of this chart is clear: To become “Data Centric”, you must leave Excel behind.
Unfortunately, the reality is often different. You can spend millions building a cloud-native platform, implementing Snowflake, dbt, and designing stunning Tableau dashboards. You can reach the top right of that chart technically. Yet, in the board meetings and finance reviews where the actual decisions happen, the question remains: “Can I get this in Excel?”

The reality is that while your infrastructure moves up the curve, your business users often refuse to leave the starting line. And perhaps they are right.
This post argues that true data centricity isn’t about eliminating Excel; it’s about embracing it. We need to stop treating spreadsheets as a “low maturity” phase we grow out of, and start treating them as a permanent, critical interface in our high-maturity stack.
But first, we have to admit why we wanted to kill Excel in the first place.
The problem with Excel (Why engineers and architects hate it)
There is a good reason Excel is ranked lowest on that chart. Without strict rules, Excel becomes messy and unstable. This creates a lot of future work and, worst of all, makes people doubt that the numbers are correct.
Here are three distinct risks that make data teams allergic to spreadsheets:
The “Metric Drift” and Quality Chaos
The moment a user hits “Export,” they stop consuming data and start manufacturing it. When everyone is “slicing and dicing” raw data on their local machines, definitions start to drift. One manager filters out “refunds” to calculate Revenue; another manager doesn’t. You end up in a meeting with two different numbers for the exact same metric. This isn’t just annoying; it’s a data quality failure, potentially leading to a wrong decision with huge impact!The data is stale as soon as you export it
A database is a living organism; an Excel export is a fossil. The second a file is saved, it is out of sync. While your cloud data warehouse updates with every data pipeline run, the Excel sheet circulating in the C-suite is from last Tuesday. Decisions are made on stale information, and critical context, like a sudden data pipeline failure or a schema change, is completely lost once the data leaves the platform.The Governance Black Hole
A secure database has Role-Based Access Control (RBAC) and audit logs. An Excel file has “Save As.” Once a sensitive report is exported, it enters the “Email Dark Web.” It gets attached to email threads, forwarded to external partners, or saved on personal drives. You lose all visibility into who has the data, who should have the data, and which version is actually being used. It is the ultimate security and governance leak.
The above three reasons are the main culprits, and we didn’t even talk about limited scalability where large files crash, the lack of structural integrity to prevent dirty data and the high risk of manual entry errors that can silently compromise your entire analysis.
But wait… business always ask for Excel
It is easy to criticize spreadsheets, but we have to face reality. Business teams always ask for Excel.
I see this in my own education. I am currently studying for my MBA. In my first three classes, we had to use Excel every time. Most of my classmates are not technical engineers. They are business people, and Excel is the language they speak.
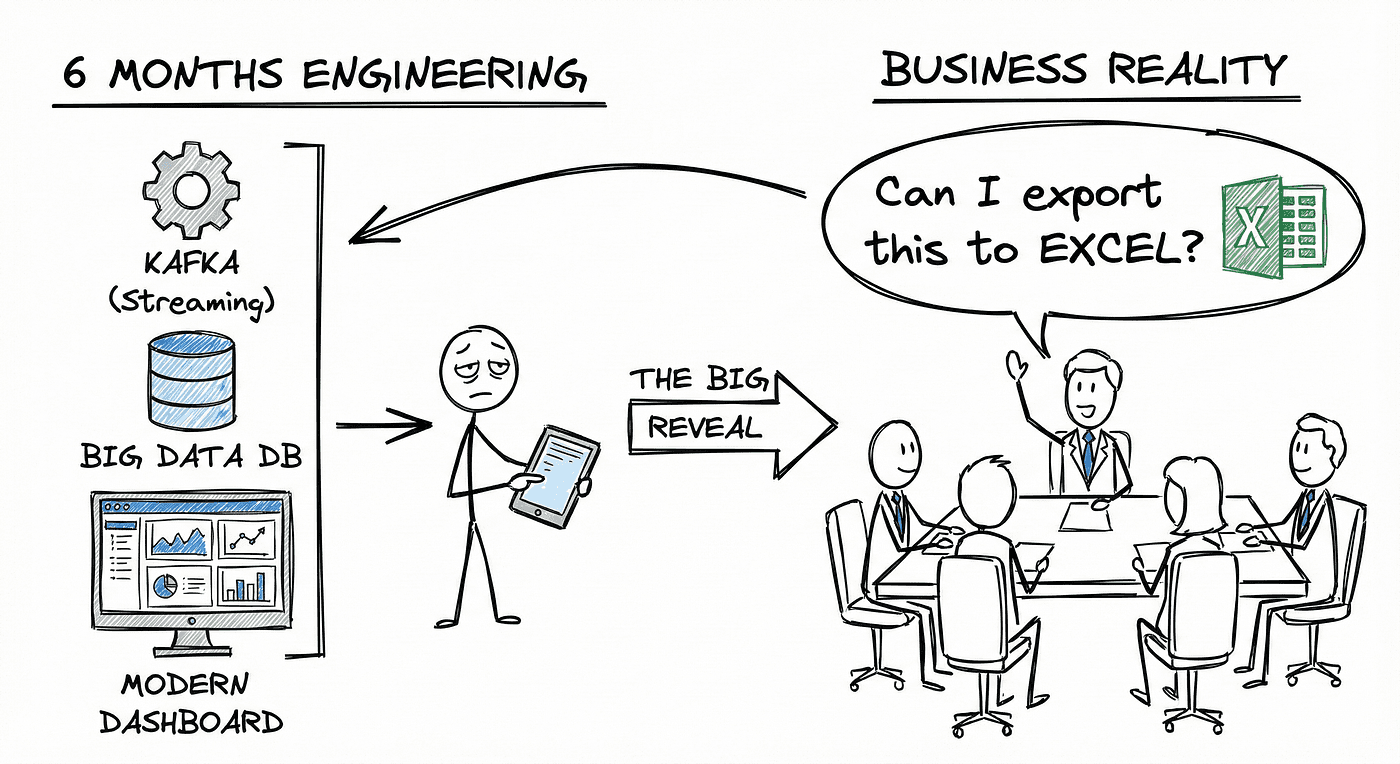
I also saw this in my career as a software engineer. I once spent six months building a complex tool to forecast airport passenger traffic. We used advanced technology like Kafka and built a modern dashboard. After all that hard work, the first question the users asked: “Can I export this data to Excel?”
We often build sophisticated dashboards and data products. However, we forget one major thing. Non-technical people need an easy way to access the data. They want to perform ‘last-mile analytics.’ They want the freedom to combine data with other numbers, play with the visualizations, or wrangle the data to fit their specific context.
Frequently, the tools we build are locked behind technical barriers. Or, the dashboard is almost right but not exactly what they need. It might lack a specific filter or a certain calculation. When a tool is rigid or hard to access, business users not only feel stuck, we leave ROI on the table if we ignore Business Analysts and domain experts. These people know the business better than anyone, and their tool of choice is Excel. Here is why they prefer it:
It is easy to start but powerful: You can begin with a simple sum function and slowly learn more. Some people eventually build things as complex as rollercoaster simulators.
It is great for exploring: Most business intelligence tools are rigid. in Excel, you can copy a tab, change two numbers, and immediately see a new forecast.
No gatekeepers: In big companies, getting a dashboard changed can take months. With Excel, you can pull the data you have, add your own columns, and solve the problem yourself today.
Bridging the Gap: The “Managed Excel” Strategy
We cannot ban Excel, but we cannot let it run wild either. The solution is to move from “Shadow IT” to a “Managed Excel” strategy. We need to mitigate the risks of bad data while still allowing business experts to do their work.
Here is how modern data engineering trends can help us build a safe environment for spreadsheets.
1. The Restaurant Rule: Only Serve the “Gold”
In the past, data teams often let users access raw data tables just to get them off their backs. This is dangerous.
Imagine a restaurant. You do not let customers walk into the kitchen to grab ingredients from the fridge. They might grab raw chicken, or they might get in the way of the chefs. Instead, they stay in the dining room and are served a finished meal.
We must treat data the same way. We should never allow Excel exports from the internal “kitchen” of our data warehouse. Those are the Bronze and Silver layers where data is still being cleaned.
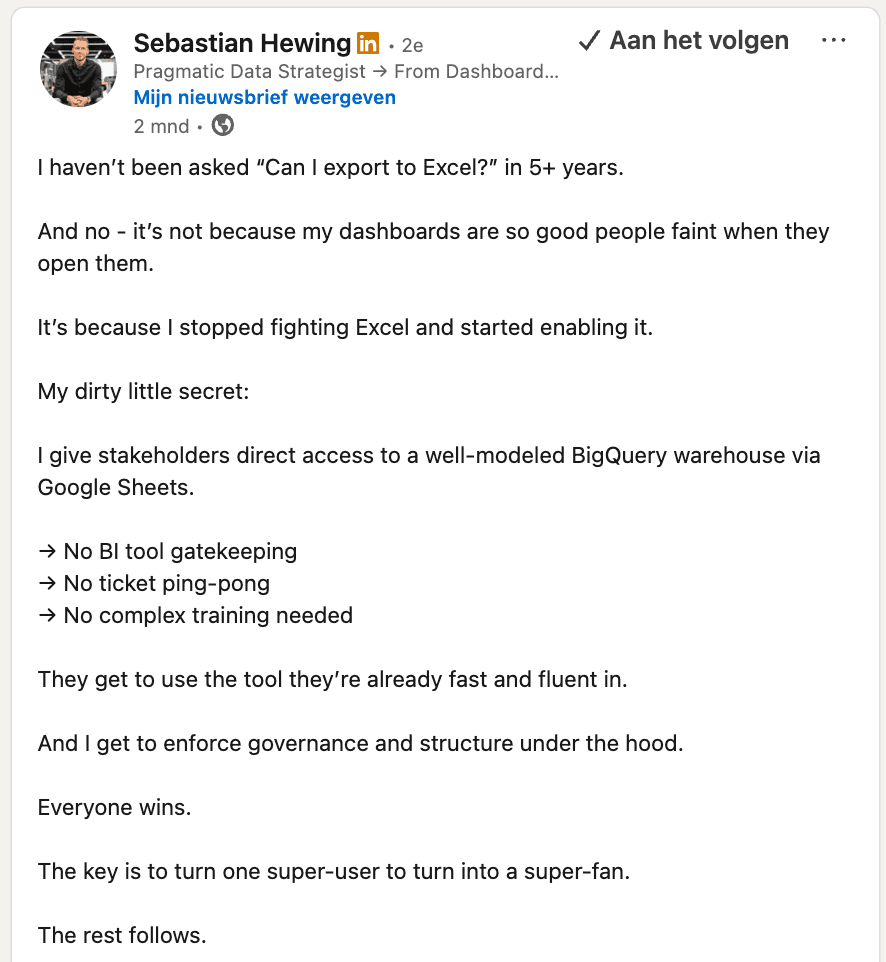
Pictured above: LinkedIn post of Sebastian Hewing on giving direct access to “well-modeled” data
Instead, we should only allow connections to Data Products. These are the “Gold” layer. A Data Product (output port) (let’s not get into semantics!) is a clean, finished (set of) table(s) with a clear owner and a guarantee that the data is correct. It is the single, unique interface for that specific data.
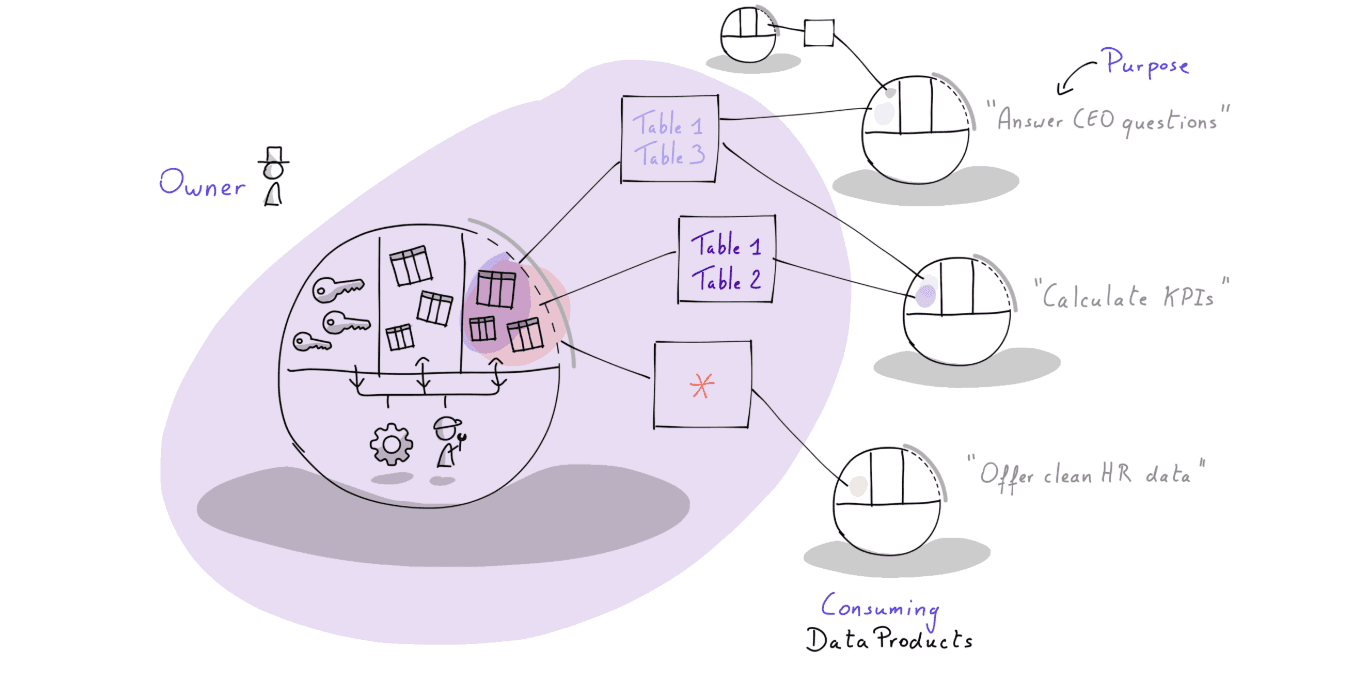
Only the final curated “gold” tables are accessible by other data products and Excel usage
2. Strict Ownership and Safety Nets
If a team publishes a Data Product, they must own it. This is a discipline issue, not just a technical one.
The team that creates the data is responsible for testing it and documenting it. Because they own it, they also act as the gatekeeper. They decide who is allowed to access it based on the user’s needs.
To make this safer, we can use modern security features like Dynamic Data Masking and Row Access Policies.
Masking: If a user exports a customer list to Excel, the “Email” column can automatically be hidden or hashed if that user does not have high-level clearance.
Row Policies: A regional manager in France will only see French data in their export, even if they try to access the global table.
3. Context Reduces Chaos: Put the Export Button in the right place
One of the biggest risks with Excel is that it strips away context. When a user opens a raw CSV file, they see numbers and headers, but they lose the instruction manual. They might guess that a column named “Revenue” includes tax, when it actually does not. These small assumption mistakes lead to wrong decisions.
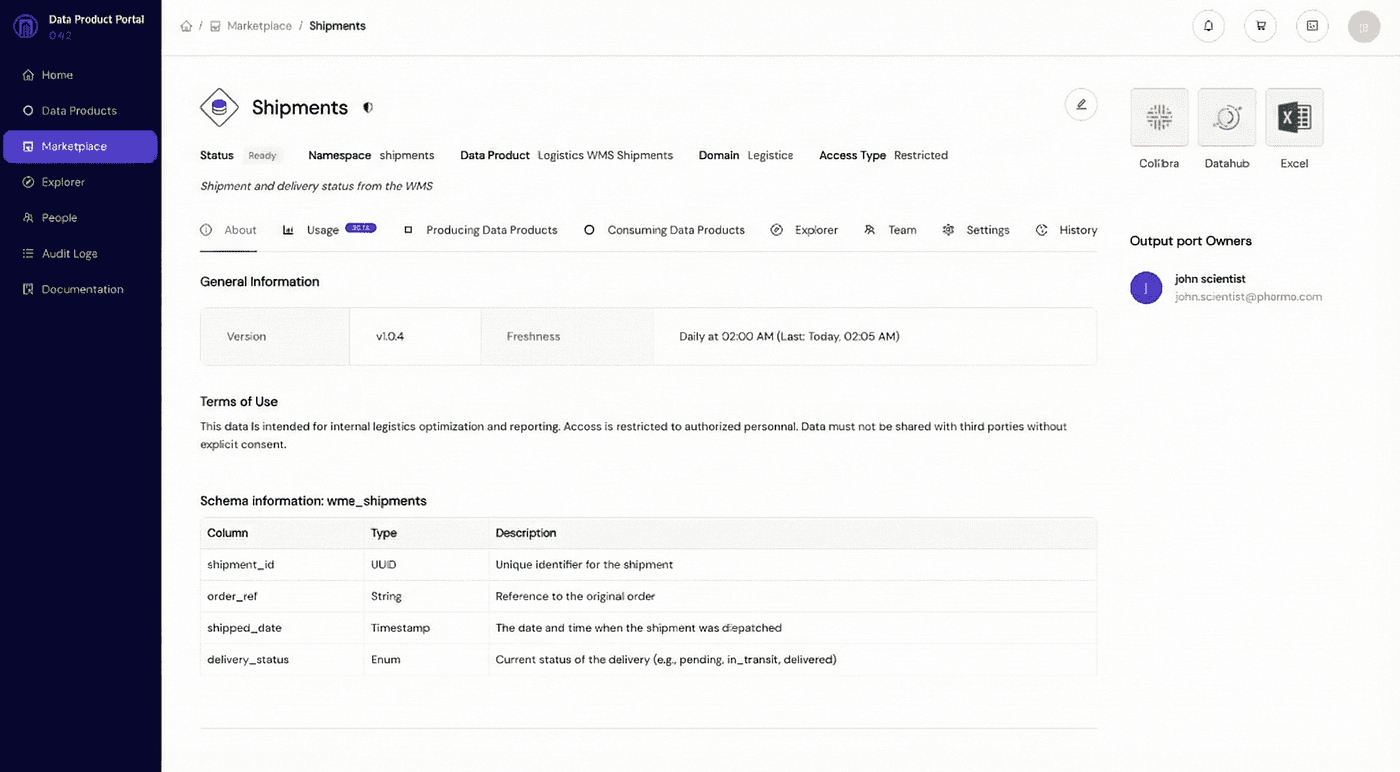
Pictured above: an example of a governance tool: https://portal.dataminded.com/
To fix this, we need to change where the user gets the data.
The “Export to Excel” button should not be a hidden query result. It should live inside your data product governance tool of choice, exactly where the data is documented.
When users download data from a curated portal, they are immersed in context before they even click the button. As you can see in the screenshot above, the Excel button sits right next to the critical information:
Clear Ownership: The user knows exactly who to ask if they have a question.
Definitions: Every table and column has a clear description.
Lineage: The user can see where the data comes from and what other use cases rely on it.
By placing the export function here, we force the user to see the metadata. They understand what they are downloading. This simple design choice drastically reduces the risk of assumption mistakes because the user has the full context before they take the data offline.
4. The Live Data Dilemma: Staleness as a Feature
A common criticism of file exports is that the data is “dead” or stale the moment it hits your desktop. Technical teams often ask, “Why not connect Excel directly to the Data Warehouse?”
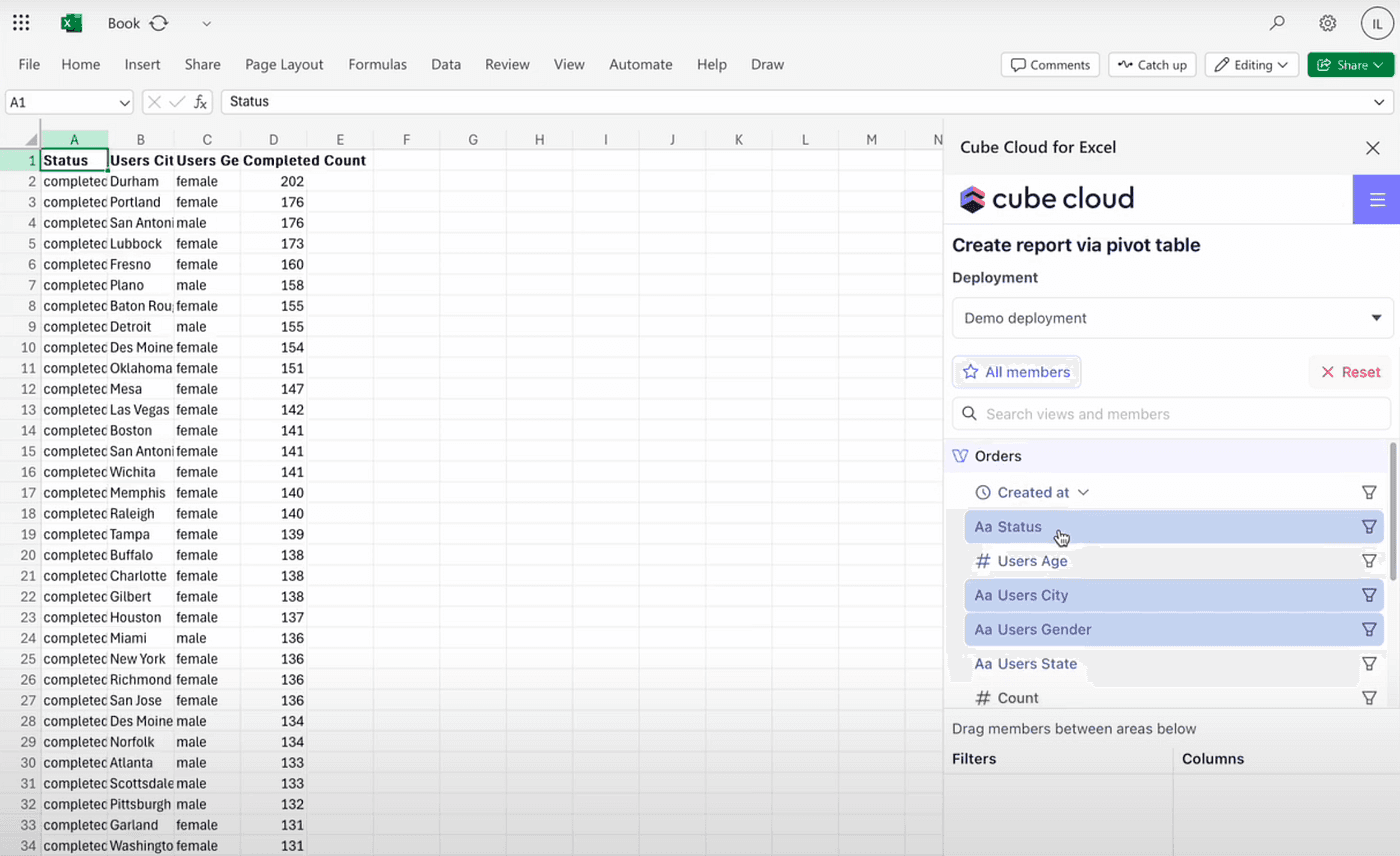
Screenshot of Cube Cloud in Excel
It is true that tools like the Snowflake Excel connector, JDBC drivers, or semantic layers like Cube allow for “live” data streams directly into spreadsheets. While this sounds perfect, strict “Managed Excel” strategies often prefer static downloads for two strategic reasons.
The Context Trap: Direct connections bypass the governance portal. Users get numbers but lose critical context like definitions and ownership. While you can add semantic layers to fix this, it often forces you to duplicate the authorization logic you already built in your data warehouse. It’s certainly an option worth considering, but it adds complexity and maintenance.
Staleness is an Incentive: More importantly, static files provide a hidden benefit: friction. If you give a user a live connection, they can build a robust “Shadow Dashboard” in Excel that updates automatically every morning. It works so well that they never tell you about it. It becomes a critical business dependency that runs entirely on a laptop, unmonitored and fragile. However, if that user has to manually log in and download a file every day to get fresh numbers, they feel the pain. That friction is a feature, not a bug. Eventually, they will come to the data team and say, “I am downloading this file every day. Can we please automate this?” That is the victory. That manual friction is the incentive that drives users to ask for Industrialization. It ensures that Excel remains a tool for exploration, not for permanent production pipelines.
5. Duties and Rights: The Social Contract
Technology solves half the problem, but the other half is human behavior. We need a clear agreement on “Duties and Rights.”
We know that we denied access to raw source tables in Point 1. This adds friction, but we can turn that friction into a positive incentive. We offer a “carrot.”
If business users want that easy Excel export, they must collaborate with the domain team to define the Data Product first. They have to help validate the data and define the rules. Once they put in that effort, they unlock the access they want. This structure ensures that users are willing to do the hard work of governance because the reward is the tool they love.
We offer them a clear deal:
The Right: You can access data for exploration and verification. We encourage you to look for patterns!
The Duty: You cannot use this for “industrialized” processes. You cannot run the company monthly finance report off a manual export on your laptop (ensure that these agreements are supported by the directors!).
If a user finds a valuable pattern in Excel, they must come back to the data team. Then, the data team can turn that spreadsheet into a real, automated data product.
The “Read-Only” Handshake: We can enforce this agreement at the moment of access. Before a user can download data, they should see a disclaimer. The exported data is read-only and users must acknowledge that it is valid only for right now.
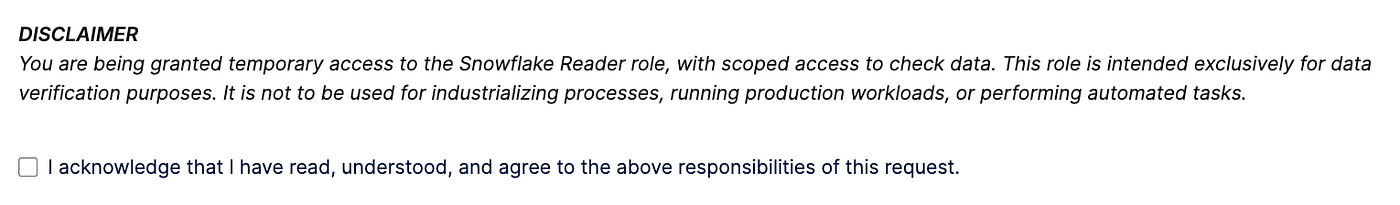
Pictured above: the user must explicitly agree that they are not building production workloads on top of this temporary file
6. Trust But Verify (Audit Logs)
We can be lenient with access because modern tools allow us to watch what happens. We can use the built-in audit logging of data warehouses like Snowflake to detect bad habits.
If we see the same user running the exact same heavy query every Monday at 9:00 AM, that is a red flag. It means they have built a manual business process on top of a temporary export. We can spot this with a simple query:
When you see this pattern, you do not ban the user. You approach them and say, “I see this report is important to you. Let’s automate this so you don’t have to do it manually.”
7. All Access is Temporary
Finally, no access should be forever.
Data governance rots over time if we are not careful. A simple rule is to make all direct data access temporary. You can grant a user access to a Data Product for three months. After that time, the system automatically revokes it.
If they still need the data, they must request it again and state their business reason. This keeps the ecosystem clean and ensures that old “shadow” Excel sheets do not stay connected to the database forever.
Press enter or click to view image in full size

Pictured above: required form field when requesting read access to a data product
Conclusion: Stop Fighting the Genie
Excel is here to stay. It is simply too useful and solves problems too quickly to ever disappear.
For a long time, data teams have treated Excel like the villain. It is often seen as our nemesis. In some cases, this is true. We have all been in frustrating meetings where two teams bring conflicting metrics. We have all offered to “automate” a process, only to discover a nightmare spreadsheet with more complex formulas than our actual code.
However, we need to step outside the data team bubble. For many business users, Excel is the only way they can access data freely. It allows them to work without asking for permission or waiting for approval. You are not going to take that away from them.
The reality is that many companies run on Excel. No matter how much we want to put that genie back in its bottle, spreadsheets will be around far longer than your current dashboard.
The solution is not to ban Excel. The solution is to embrace it with the right guardrails. By using modern data engineering practices like Data Products, clear ownership, and audit logs, we can finally build a healthy relationship with the business side.
We should stop focusing only on policing users. Instead, we should focus on enabling them. If we can find the right balance between strict governance and creative freedom, we turn our biggest problem into our biggest asset.
Final thoughts: what about AI?
Wait a minute. Is Excel still necessary in the age of GenAI and autonomous AI agents?
Many companies are currently working to make their data “AI-ready.” They want autonomous agents to be able to consume data and answer questions automatically. How to achieve this is out of scope of this blog post, but you need strong metadata, clear context, and strict guardrails around your data.
We might be heading toward a future where we only use chat interfaces. We might eventually do everything, from analyzing data to booking travel, through a simple text prompt. Companies like OpenAI are driving this change rapidly with tools such as ChatGPT Atlas.
However, until that reality fully arrives, you can focus on your data foundations. The interesting part is that preparing for AI is quite similar to preparing for a safe Excel strategy. Both require you to define your data clearly, set up ownership, and build clean interfaces.
Microsoft Copilot is already supercharging how business users work with spreadsheets. If you build the right foundations now, you get a double benefit. You allow your human experts to use Excel safely today, and you build the architecture that your AI agents will need tomorrow.
Use your human assets to verify and strengthen your data now, so your AI is ready for the future.
Latest

Data Platforms for humans
Data platforms fail when people are ignored. Why kindness and communication matter as much as architecture.

The Boring Stuff That Keeps You in the 5%
GenAI fails not because of models, but missing engineering, data, and product thinking. The “boring work” is what makes it real.

You Built a Data Mesh, But Your Metrics Are Still a Mess. Here’s Why.
Even with data mesh, metrics break: decentralized logic, no ownership, and cross-domain gaps. A semantic layer unifies KPIs.
