You Built a Data Mesh, But Your Metrics Are Still a Mess. Here’s Why.
•
Nathan Derave
Even with data mesh, metrics break: decentralized logic, no ownership, and cross-domain gaps. A semantic layer unifies KPIs.
At Dataminded, we work with organizations at various stages of their data journey. One pattern we keep running into: teams that have invested heavily in building solid data products across their domains, only to realize that the last mile — serving consistent, governed metrics to consumers — is still unsolved.
1. When every domain speaks its own metric language
Before diving in, let’s align on what we mean by data products in a data mesh context. A data product is a reusable, standardized data asset that delivers measurable value to its consumers. It has an owner, a lifecycle, quality expectations, and a clear purpose. In a data mesh architecture, domain teams own their data products end-to-end: schema design, quality guarantees, and how it’s served.
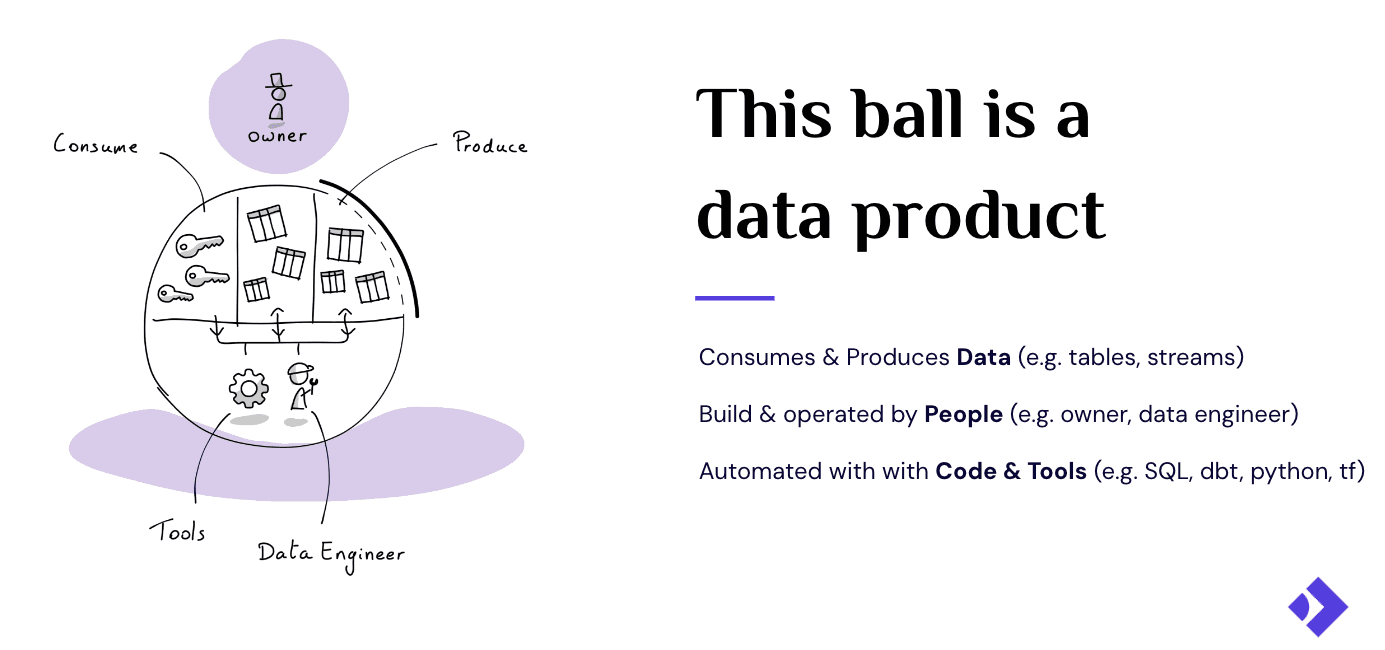
The promise is compelling: teams belonging to a domain build and operate data products that independently add value. The sales team owns its order data. The finance team owns its billing data. The marketing team owns its campaign performance data. A data science team can consume all of those to build a churn prediction model on top. Each product is discoverable, understandable, and accessible on its own terms. All of them put together create a mesh of products consuming and producing for each other.
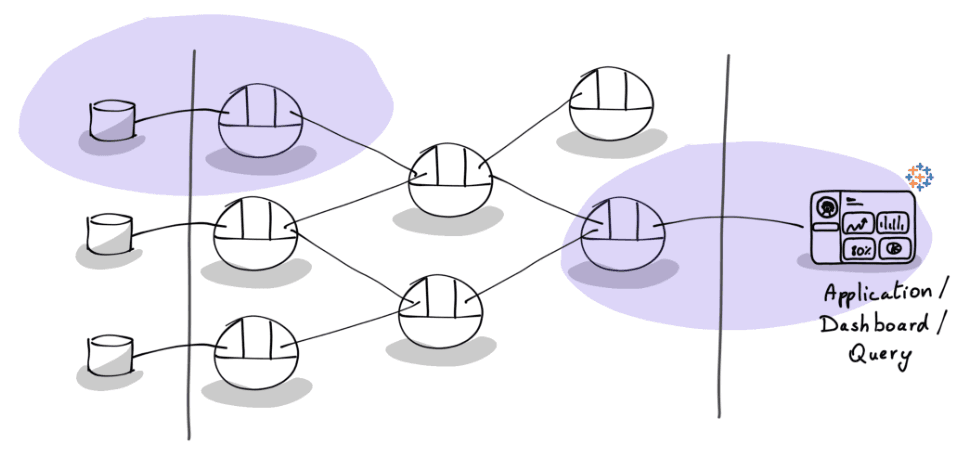
This works well when data products are consumed within their domain. The trouble starts when you need to compose across domains:
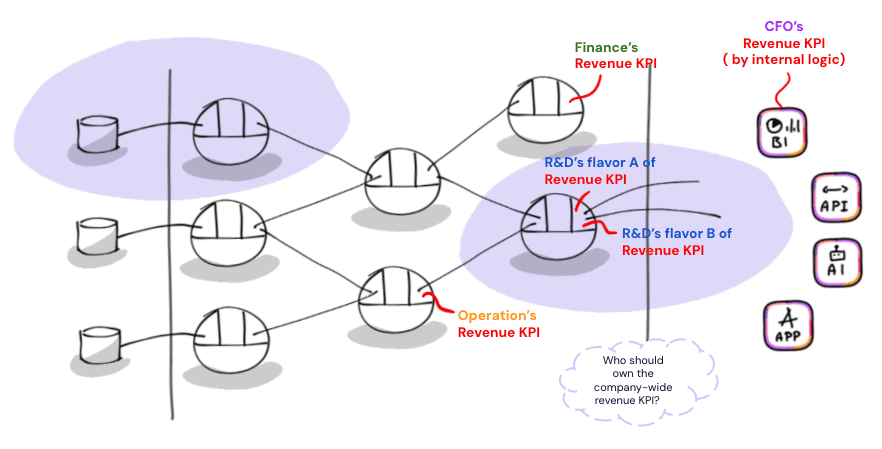
🍏🍍🍊 Metric drift is a structural side effect of decentralized ownership: When each team independently defines its own metrics, “revenue” means top-line pre-refund for sales and net recognized post-chargeback for finance. Both are correct in context. But surface them side by side on an executive dashboard and you end up with five dashboards showing five different numbers. Trust erodes, and meetings become debugging sessions.
🧩 Cross-domain metrics don’t belong to anyone: Customer lifetime value requires order history from sales, ticket volume from support, and subscription data from billing. A customer health score that weighs monthly revenue against support burden needs all three. No single domain owns these metrics. This composition problem is structural: it’s a direct consequence of the independence that makes data mesh work.
🔀 Business logic lives in too many places: Finance defines revenue in Power BI, data science re-derives it in a notebook, an embedded app computes it in React, an LLM agent generates its own SQL interpretation. Same metric, four implementations, four potential divergences. This is the “logic-in-the-tool” pattern replicated at data mesh scale.
In summary, the last-mile gap remains open. Domain teams build clean data products. They own it end to end. They use standard transformation tools and techniques like dbt or Python code to produce modeled, tested tables. The physical data is in good shape from an engineering point of view. But there is still a gap between having clean, consumable tables and actually answering clear business questions and KPIs in a deterministic manner, from a single point of truth.
📍 This is a platform empowerment problem. There is no clear ownership nor capability in the stack that handles the aggregation and standardization of cross-domain metrics for consumption. Your data platform provides compute, storage, orchestration, and governance. But not a unified way to define and serve business metrics.
2. Semantic layer to the rescue!
A semantic layer is an abstraction between physical storage and consumption. It sits between your warehouse or lakehouse and the interfaces that consume data: BI tools, applications, notebooks, AI agents. Its job is to decouple business metric definitions from both the underlying tables and the tools that visualize them. Instead of each tool re-implementing “how to compute revenue,” the semantic layer defines it once and exposes it via APIs. Every consumer queries the same definition and gets the same number.
It moves metric logic from tools into code. In the legacy BI world, metric formulas live inside proprietary tools. Revenue is defined in DAX inside Power BI. It’s defined again in a calculated field in Tableau. And again in a SQL snippet in Looker.
A semantic layer extracts that logic into version-controlled configuration, typically YAML files that describe measures, dimensions, and join paths declaratively. This brings metric definitions into standard software engineering workflows: Git, pull requests, code review, CI/CD, automated testing. When a definition changes, a developer modifies a YAML file, gets it reviewed, and merges it. Every connected consumer picks up the update immediately.
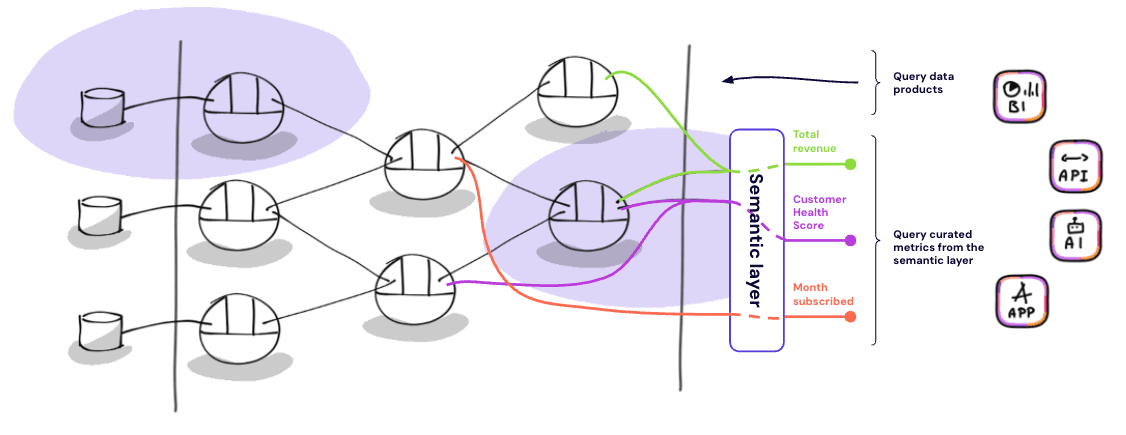
A semantic layer curates metrics at a single place and expose them via standard ports.
How does a semantic layer fit in data product thinking?
Through a data product lens, a semantic layer IS a consumer-aligned data product. In the case above, we even went further and modeled it as a single data product that owns the aggregation for the whole organisation (we’ll get back to this later in the article). It sits at the rightmost position of the data product value chain, just before consumption. It doesn’t own the raw data. It reads from other data products and aggregates them into a unified set of metric definitions. You can implement this either by:
building it yourself as a data product (a dbt project, a set of views, custom APIs) — basically another data product like others but with a clear purpose to curate business metrics and expose them.
adopting a dedicated semantic layer tool (like the ones we’ll cover next) that handles caching, query optimization, and API exposure out of the box.
Importantly, adopting a semantic layer should be considered as a complement, not a gate. Consumer applications can still go directly to individual data products when they need to. The semantic layer adds a unified metric access point on top, it doesn’t replace direct consumption.
What about an example?
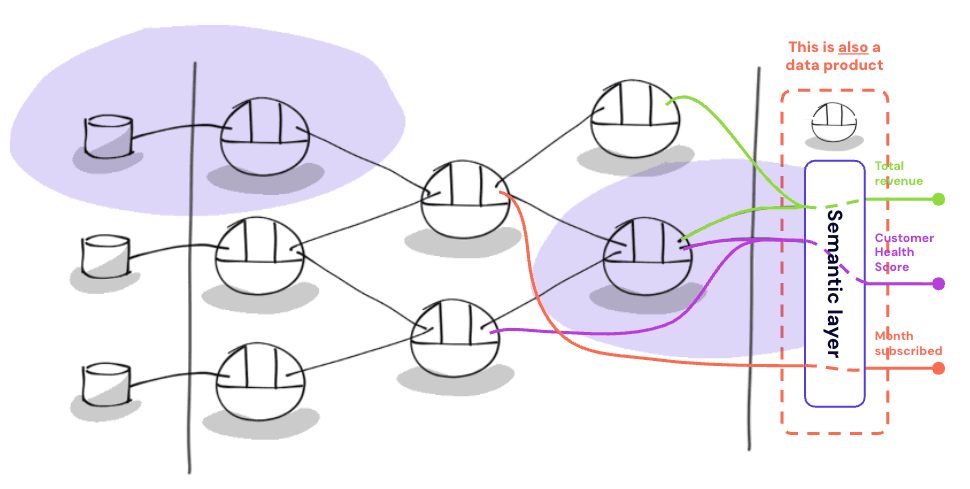
To make this tangible, here’s what a semantic layer definition can look like using Cube’s data modeling syntax. Imagine you need a customer lifetime value metric that composes data from three different domain data products: sales_order which tracks transactional order history, customer_support which captures ticket volume and resolution data, and subscription_billing which holds recurring revenue and tenure information:
The first three measures each pull from a different upstream data product. The last one, customer_health_score, is where it gets interesting: it combines revenue from sales_orders , ticket count from customer_support , and tenure from subcription_billing , all computed from different data products into a single KPI that no domain could compute on its own. The semantic layer resolves the join paths, computes the aggregation, and exposes the result through a single API endpoint. A consumer requesting customer_health_score by segment doesn’t need to know which tables are involved, how they join, or what SQL dialect is needed.
Under the hood, it compiles definitions into SQL. The semantic layer parses these YAML definitions, builds an internal graph of the entire business logic model, and at query time generates optimized, dialect-specific SQL. It handles join path resolution, aggregation logic, caching, and access controls. The consumer just requests “net revenue by region by month” and the semantic layer handles the rest.
It exposes metrics as APIs, not charts. This is the critical distinction from legacy BI. A semantic layer serves metrics programmatically via REST, GraphQL, and/or SQL APIs. This is what makes it relevant for modern consumption patterns beyond dashboards: embedded analytics in customer-facing applications, AI agents that need deterministic metric access, machine-to-machine data exchange, and notebook-based workflows. An LLM agent connected to a raw database schema is likely to generate logically incorrect SQL. Connected to a semantic layer, it accesses a curated list of business-native objects and issues an API request. The semantic layer handles the SQL generation deterministically.
3. Should the semantic layer be central?
But wait… Now we’re back to a centralized piece of architecture that owns all the organization’s metrics? Who owns that? Who defines the “truth”? What if I want to propose a change? Can I do that if I’m not on that team?
Aaaand we’re back
You guessed it: we’re back to a centralization vs. decentralization problem. The thing is, those questions expose the two sides of a single coin:
On one hand, there’s a need to curate business metric definitions. That leads to the creation of a dedicated data product, as we’ve seen earlier in this article. That very specific data product — which we’ve called, so far, THE semantic layer — exposes data (the metrics) via an API output port. Great. That’s a specific data product with a clear purpose.
The unique semantic layer we’ve talked about until now is just a data product among others (with the specific purpose of aggregating high-level organizational KPIs).
On the other hand, exposing curated metrics along with their definitions, metadata, etc., through an API output port is something that can be achieved by any data product. This means that every data product can have its own semantic layer. Ultimately, a semantic layer can be considered a data product’s standard output port, just like tables, flat files, or a REST API.
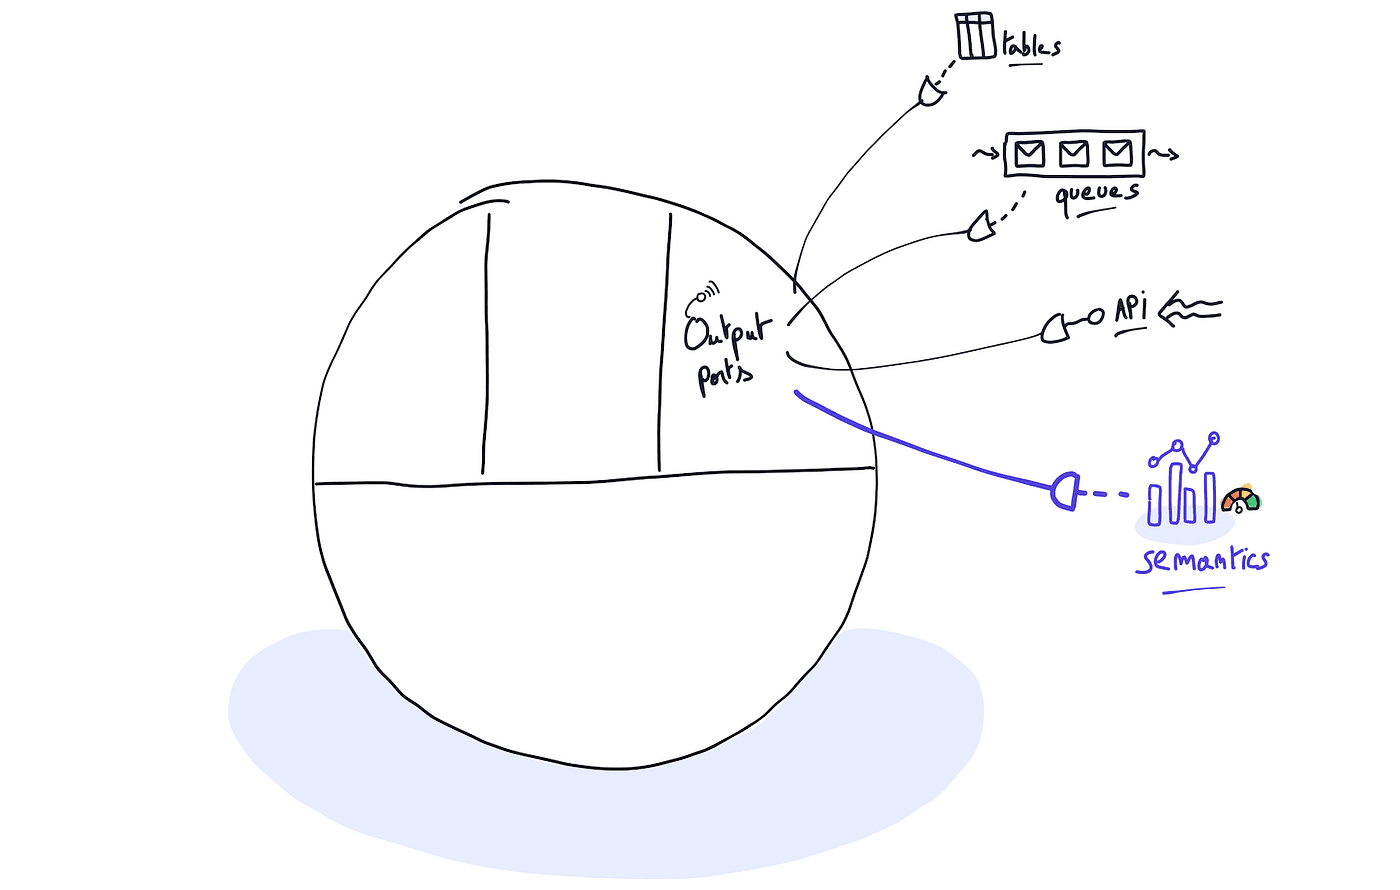
In the end, a semantic layer is just another data product output port…
So, what should we do? Probably consider both!
By doing so, our interpretation of what a semantic layer is can be broadened from a strict architectural element to a specific platform capability. If you recall the introductory definition we gave for a semantic layer, it never said it needed to be unique:
[…] Its job is to decouple business metric definitions from both the underlying tables and the tools that visualize them. Instead of each tool re-implementing “how to compute revenue,” the semantic layer defines it once and exposes it via APIs. Every consumer queries the same definition and gets the same number. […]
See? The functional value of a semantic layer never lied in its uniqueness. It resides in the centralization of metric metadata (definitions, business glossaries, etc.) and their exposure through a unified interface.
For example, multiple domains (finance, marketing, operations, etc.) within an organization might each have a data product that publishes their specific vision of what a “customer” is. Along with that, each will likely also have a way to compute metrics and KPIs about those customers.
By publishing clear semantics of what those metrics are at their level (how they are computed, what their limitations are, etc.), these data products make their vision of the business visible.
Regrouping and curating those visions at the organizational level is critical. That’s the role of another dedicated data product that will curate, align, and perhaps supersede the metrics published by others, providing a single pane of glass for the business to make decisions.
So, let’s recap:
📦 At the individual product level: Every data product can expose a semantic layer as one of its output ports. Think of it as a shortcut or a TL;DR for what can be computed from the published tables (similar to the product owners saying, “Hey, this is how we recommend you query our tables”). The implementation can take many forms ranging from the classic SQL the team is already doing for ages (exposing a table with a few metrics and descriptions) to the fancy dedicated semantic layer capabilites (YAML-driven) we showed above. That’s a decision your data platform team should take.
🏫 At the organization level: You most likely need a dedicated data product (located at the very end of your data value chain) to clearly define, compute (or re-use), and expose your key business metrics and KPIs. Ultimately, this is “just” a data product among others.
With that in mind, it’s clear that our three original challenges (metric drift, cross-domain metrics, and business logic) should be addressed by that dedicated data product curating and computing the key business metrics and KPIs.
And who should own that?
The core of any successful data product resides in clear, uncompromising ownership over its entire lifecycle. Over the past few years, we’ve seen business domains mature to the point where they have dedicated teams building, maintaining, and serving their data to the rest of the organization.
But when it comes to the specific role of creating and curating high-level metrics for strategic decision-making, we often hit a wall. This “organization-level” data product needs that exact same clarity of ownership.
So, who should own it? The CEO? The CFO? The entire C-suite?
Let’s be honest: this isn’t an easy question. The exact job title matters less than the placement of the authority. What is absolutely clear is that ownership must be placed at the highest strategic level, and the people operating at that level must be genuinely empowered to own the indicators they need to take their decisions.
Practically speaking, this means the execution will likely fall into one of two paths:
The partnership model: Data professionals for the organization work hand-in-hand with C-suite executives. The executives own the business definition, and the data team owns the technical implementation within the semantic layer.
The self-serve model: C-suite executives (or their strategic proxies) are empowered by the platform to completely self-serve, defining and curating these metrics directly within the organisation data wealth (undertand — other data products regrouped in catalogs, etc) themselves.
Which path is more realistic given the tools we have today? That will be the topic of my next article, where I’ll provide an overview of the current semantic layer landscape. But without spoiling too much… let’s just say that multiple profiles (business and data alike) are still going to have to work closely together in the future 😉.
4. Yep. The last mile is still the most important.
Building a robust data mesh is a massive achievement, but it’s not the finish line. If your domain teams are producing high-quality data products, yet your executives are still arguing in boardrooms over whose dashboard has the “real” revenue number, your architecture hasn’t fully delivered on its promise.
Semantic layers are the missing bridge between clean data engineering and actual business value. By treating your key business metrics as a top-tier, organization-level data product, you pull the business logic out of isolated BI tools and into a unified, version-controlled system. You get the best of both worlds: domain teams maintain their autonomy and agility, while the business gets a single, reliable pane of glass to drive decisions.
The technology exists, and the architectural patterns are clear. The real challenge now is organizational alignment and finding the right tools to empower your decision-makers.
We’ve covered the what and the why. Next time, we’ll dive into the how — exploring the current landscape of semantic layer tools and answering the burning question of whether a truly self-serve semantic layer is a reality or just a pipe dream. Stay tuned! 👋
Latest

Data Platforms for humans
Data platforms fail when people are ignored. Why kindness and communication matter as much as architecture.

The Boring Stuff That Keeps You in the 5%
GenAI fails not because of models, but missing engineering, data, and product thinking. The “boring work” is what makes it real.

You Built a Data Mesh, But Your Metrics Are Still a Mess. Here’s Why.
Even with data mesh, metrics break: decentralized logic, no ownership, and cross-domain gaps. A semantic layer unifies KPIs.
